- Home
- Views On News
- Jul 14, 2023 - Is the Indian IT Sector a Sleeping Giant?
Is the Indian IT Sector a Sleeping Giant?
The Indian IT sector, known for its prowess in the global technology space, has witnessed relative underperformance compared to the Nasdaq index in recent months.
The Nasdaq Composite index reached a new 52-week high yesterday. The Nifty IT index also gained some bullish momentum following the release of Q1 results of headlines companies like TCS and HCL Technologies.
In this piece, we aim to examine the technical structure of the Nifty IT index and its underperformance over the Nasdaq.
Additionally, we will explore the accumulation phase on the weekly chart of the Nasdaq and the Nifty IT index, emphasizing its validity and resistance zone, while noting its current position in phase C of Wyckoff Theory.
Why Indian IT stocks underperformed compared to Nasdaq...
There are three reasons that could summarize the underperformance -
a) Currency Fluctuations: Indian IT companies rely heavily on exports, and currency fluctuations, especially a stronger Indian Rupee, can impact their revenue growth.
This factor has been one of the key reasons for the underperformance compared to the dollar-denominated Nasdaq.
Indian Rupee against the US Dollar is trending in the range of 81-83 for nearly 8 months now.
b) Market Sentiment and Investor Preference: Investor sentiment plays a crucial role. In recent times, the market has shown a preference for growth-oriented technology stocks, primarily concentrated in the US, leading to higher valuations and demand for Nasdaq-listed companies.
In the Indian market, investors showed a preference for banking and capital goods stocks in the large-cap segment, while witnessing broad-based buying in mid-cap and small-cap stocks, including the IT mid and small-cap sectors.
Since the fall of Infosys in April 2023, investors lost confidence in large-cap IT stocks, resulting in the Nifty IT index missing out on the bullish trend of the past three months.
c) Catching up with the technology: The adoption and development of artificial intelligence (AI) in India and the United States showcase distinct characteristics and trajectories.
In the United States, AI has been at the forefront of technological advancements, with major tech giants and research institutions leading the way in AI research, development, and commercialization.
The United States has a robust ecosystem comprising well-established companies, venture capital funding, and a strong emphasis on AI education and talent acquisition.
On the other hand, India has witnessed significant growth in AI adoption, fuelled by a large pool of skilled IT professionals and a growing startup ecosystem.
Indian companies are increasingly leveraging AI for various applications, including healthcare, agriculture, e-commerce, and financial services.
While the US remains a global leader in AI innovation, India's AI landscape is evolving rapidly, with increasing government support, investments, and initiatives to nurture AI talent and drive AI-driven entrepreneurship.
The Technical Perspective
The accumulation phase of the Wyckoff theory is evident in both the Nasdaq and Nifty IT index.
On Nasdaq, this phase has proven to be rewarding for investors, resulting in favourable returns. However, in the case of the Nifty IT index, the accumulation phase has not translated into significant gains.
Let's examine the chart structure to gain further insights.
Nasdaq Weekly Chart

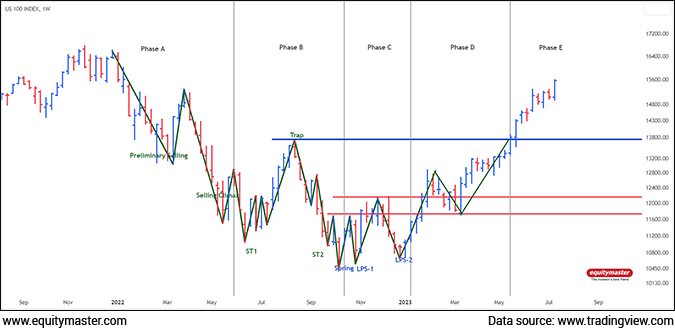
The weekly chart of Nasdaq shows a distinct accumulation phase, characterized by a prolonged sideways movement and a gradual rise higher.
During this phase, institutional investors accumulate shares, building a strong base for the subsequent price rise. The rewarding nature of this phase is evident from the consistent upward momentum and the subsequent bull run experienced by Nasdaq.
Nifty IT Index Weekly Chart

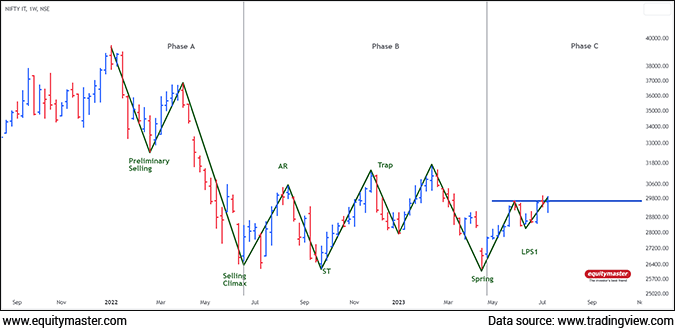
The Nifty IT index, representing the Indian IT sector, also exhibits an accumulation phase. However, unlike Nasdaq, the Nifty IT index has not broken through the resistance zone, signalling potential hesitation among market participants.
According to Wyckoff's Theory, this phase is labelled as phase C, which indicates a period of absorption, where demand and supply are in equilibrium.
Wyckoff Theory, developed by Richard Wyckoff, provides valuable insights into market phases and price movements. Phase C represents a period of testing and absorption, where supply and demand are evenly matched.
In the case of the Nifty IT index, it suggests that accumulation is still valid, but caution is warranted until a breakout from the resistance zone occurs.
While Nasdaq has entered Phase E of the Wyckoff theory, indicating a potential uptrend and favourable opportunities, the Nifty IT index has remained in Phase C due to the lack of significant opportunities in the Indian IT stock market.
The discrepancy in phases suggests that the Indian IT sector may be facing challenges or undergoing a consolidation phase, hindering its ability to progress to Phase D and eventually Phase E.
It is essential for investors and market participants to closely monitor the developments in both markets to identify potential shifts in trends and capitalize on emerging opportunities.
The Nifty IT index has recently experienced a reversal, forming the Last Point of Support according to Wyckoff's theory, around the level of ~28,300. This reversal indicates a potential shift in market sentiment.
If the index manages to break above the significant psychological level and resistance at 30,000, it could potentially accelerate the bullish scenario and enter phase D, suggesting further upward momentum and positive market conditions.
Traders and investors often closely monitor these levels as they indicate significant levels of buying interest and can present attractive opportunities for initiating long positions or managing risk.
It is advisable to keep a keen eye on the price movements within this range to gauge the strength and potential reversal points in the market.
Conclusion
The underperformance of Indian IT stocks compared to Nasdaq can be attributed to several factors.
The accumulation phase on the weekly chart of the Nasdaq has been rewarding, leading to a significant uptrend. On the other hand, the accumulation phase on the Nifty IT index is still valid but has not yet broken the resistance zone, indicating a cautious stance.
Understanding these technical aspects, along with considering fundamental factors, can provide insights for investors and market participants interested in the Indian IT sector.
Traders and investors should closely monitor Nifty IT index above 30,000, as it presents a critical zone for potential bullish reversals and accumulation opportunities to enter Phase D.
For the index to catch up with Nasdaq and progress to Phase D, it is crucial for it to initiate a reversal from the mentioned levels.
Which IT giants are you accumulating, dear reader? Share your views in the comments below.
And if you're interested in being part of my charting journey, join my telegram channel - Fast Profits Daily. You'll get access to the best trading ideas in the stock market.
Safe Stocks to Ride India's Lithium Megatrend
Lithium is the new oil. It is the key component of electric batteries.
There is a huge demand for electric batteries coming from the EV industry, large data centres, telecom companies, railways, power grid companies, and many other places.
So, in the coming years and decades, we could possibly see a sharp rally in the stocks of electric battery making companies.
If you're an investor, then you simply cannot ignore this opportunity.
Details of our SEBI Research Analyst registration are mentioned on our website - www.equitymaster.comDisclaimer: This article is for information purposes only. It is not a stock recommendation and should not be treated as such. Learn more about our recommendation services here...

Brijesh Bhatia Research Analyst and expert chartist, is the editor of Alpha Wave Profits. Fully committed to his craft, Brijesh has mastered the art of making money by trading using technical analysis. Brijesh has an MBA from ICFAI and 16 years of experience in India's financial markets. He began his career on Dalal Street as commodities dealer and it wasn't long before he developed his own unique trading system. Brijesh worked on his trading system until it could be expected to deliver 5 units of return for every unit of risk.


Equitymaster requests your view! Post a comment on "Is the Indian IT Sector a Sleeping Giant?". Click here!
Comments are moderated by Equitymaster, in accordance with the Terms of Use, and may not appear
on this article until they have been reviewed and deemed appropriate for posting.
In the meantime, you may want to share this article with your friends!